Resources
- All
- News
- Employee Spotlight
- Case Study
- Blog

Connecting Brand Equity Metrics to Digital Signals and the P&L
In the previous article on choosing the right brand equity metrics, we focused on building a tight…Read more

Choosing the Right Brand Equity Metrics for Your Business
Brand equity is one of those ideas everyone nods along with and very few teams feel they’re measuring…Read more

Brand Trackers Compared: Traditional Agencies, Self-Serve Tools, and the Delineate Alternative
Brands exist to do more than deliver a product. They represent distinctive functional and emotional benefits…Read more

From Six-Week Lag to On-Time Decisions: Inside Coca-Cola’s Real-Time Campaign Tracking
If you work in marketing, you probably know these questions by heart: “How’s that campaign doing?” …Read more

Delineate Community Grant Awards Recap – Summer 2025
As part of our Delineate Community Commitment initiative, we are thrilled to celebrate the first round…Read more

How to Drive Brand Growth in Emerging Markets With the Data You Already Have
Emerging markets have outperformed developed economies every month so far in 2025 (S&P Global).…Read more

The ‘Real’ Insights Trends for 2026
What industry leaders are overinvesting in, overlooking, and not yet capitalizing on. In early…Read more

The 7 Skills CMI Teams Will Need by 2028 (And How to Build Them)
On September 2, 2025, LEGO announced that 146 fan-designed sets had crossed the 10,000-supporter…Read more

Top Emerging Trends in CPG for 2026 – How Insights Leaders Will Respond to Influence Data-Driven Decision-Making
The CPG industry is awash with predictions on AI and personalization. But which trends…Read more

Evolving Our Product: How Delineate Is Shaping the Future of Real-Time Research
At Delineate, we’ve always believed that market research should move at the speed of…Read more

Consumer-Driven Product Innovation: The Insights Revitalizing Global Brands
Truly original product innovation in the highly competitive, fast-moving CPG market is simultaneously in…Read more

The End of The Survey? Consumer-Centric Innovation & The Research Revolution
“The trouble with market research is that people don’t think what they feel, don’t…Read more

The Ultimate Data Integration Roadmap: Uniting First-Party Research & Third-Party Analytics for the 360 Consumer View
Salesforce reports that 76% of organizations are struggling to connect insights and apply them…Read more

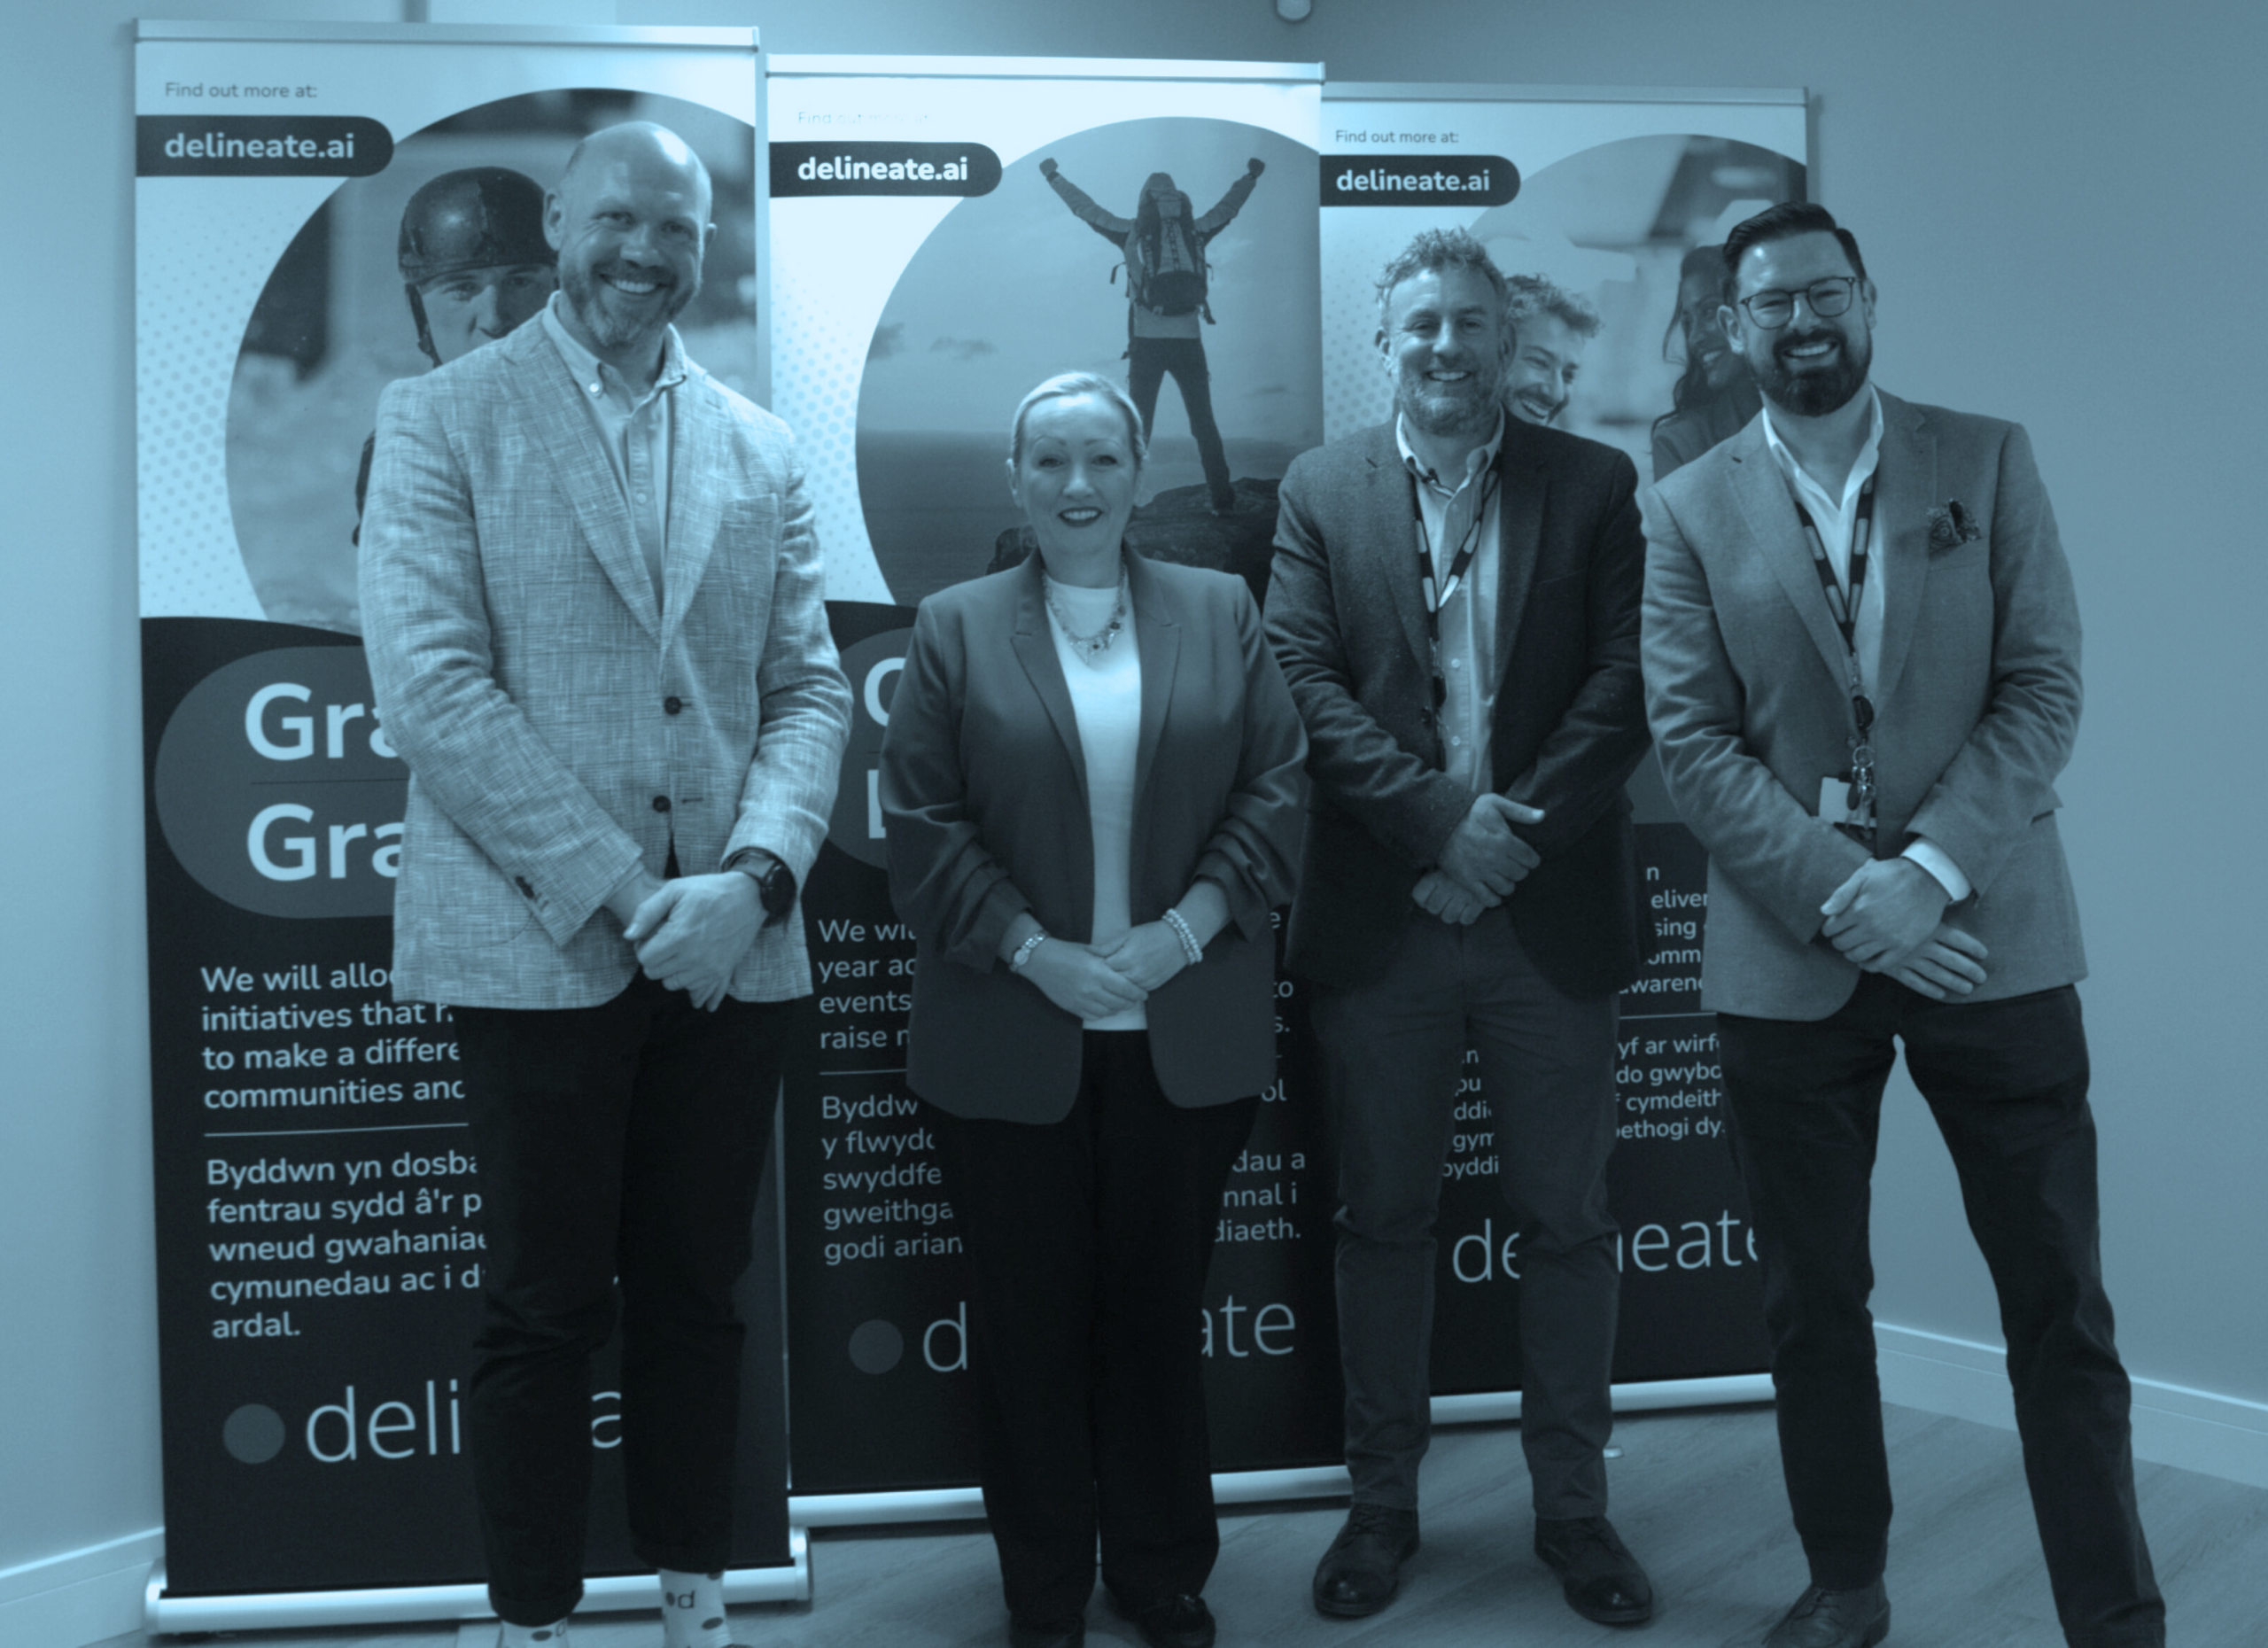
Community Commitment Launch
Think Local, Reach Global: new community commitment will deliver benefit to local areas Llandysul…Read more

Switch Your Brand Tracker to Get Better, Faster Insights – How to Assess Brand Tracking Vendors to Improve the Impact of Brand Insights
‘Brand tracking is a strong predictor of business outcomes, but the wrong measures and…Read more


